
Baltimore's Goal: 30% reduction in carbon emissions by 2025, a 60% reduction by 2030, and full carbon neutrality by 2045.
What is the Climate Action Plan?
Baltimore’s Climate Action Plan explains how the City and all Baltimoreans can work together to reduce carbon pollution, fight climate change, and build a healthier future.
Planning for the Future of Baltimore
The greatest climate threats facing Baltimore City are flooding, coastal hazards, and extreme heat. In 2022, Mayor Brandon M. Scott released a series of targets to achieve carbon neutrality by 2045 and mitigate the severity of these environmental challenges. To direct these goals the Baltimore Office of Sustainability has recently updated the Baltimore Climate Action Plan (CAP).
This update steers City actions and City-community partnerships toward carbon neutrality in a way that enhances urban sustainability, improves quality of life, enhances co-benefits, and addresses equity and climate justice. By listing actions that prioritize the conservation of resources, the CAP helps Baltimore City to reach its ambitious climate goals and thus become a safer city for current residents and future generations.
Facing the Facts
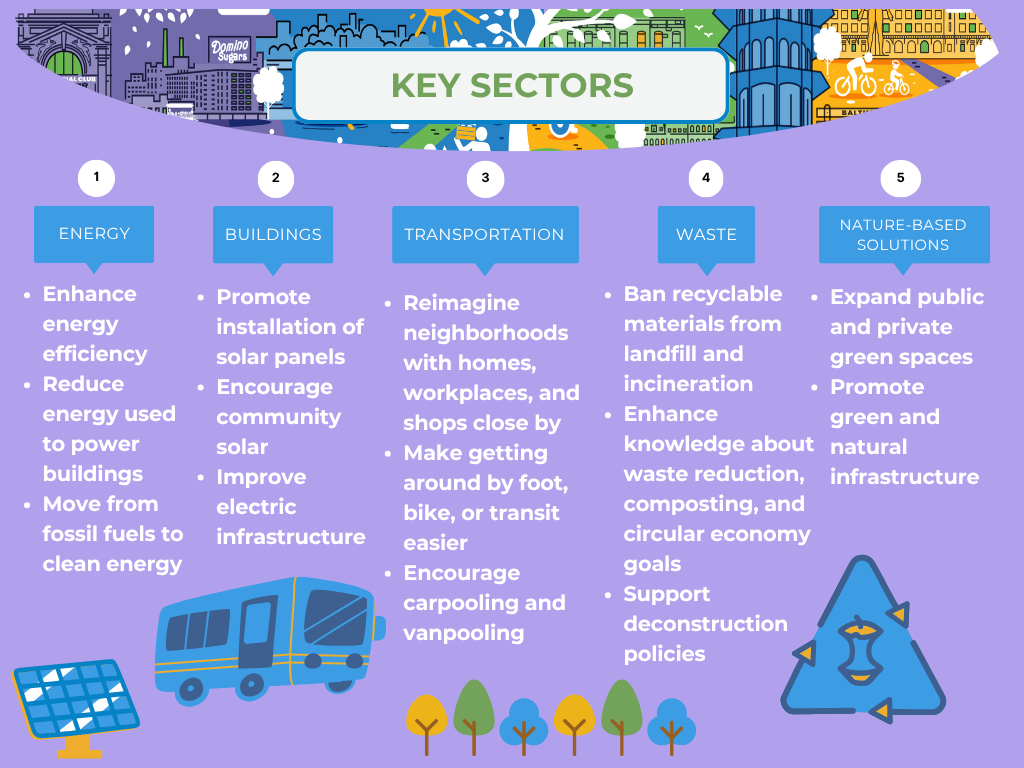
The CAP is framed by a set of guiding principles and is separated into five key sectors: Buildings, Electricity, Transportation, Waste, and Nature-Based Solutions.
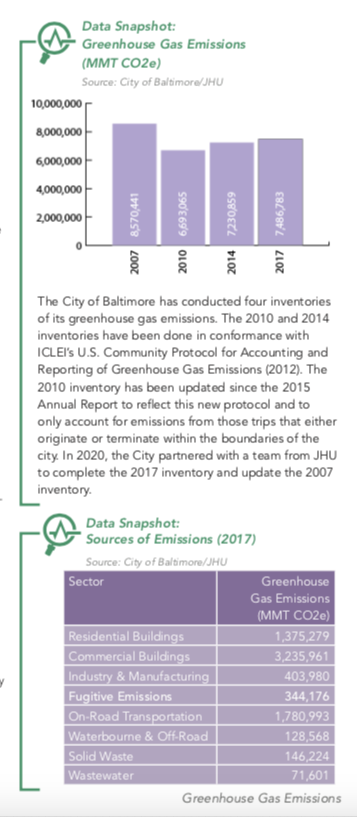
Buildings and electricity are two key sectors that look to directly address Baltimore’s primary emissions source: buildings. About 64 percent of our city’s greenhouse emissions come from the use of energy that powers our homes as well as our commercial and industrial buildings. Transportation (such as driving cars) makes up 23 percent of our emissions, while waste makes up for the remaining 13 percent.
Further Reading
Download the 2012 Climate Action Plan
2017 Baltimore GHG Emissions Inventory Report