
What is an urban heat island?
In summer months, urban air temperatures can be up to 10 degrees higher than the air of surrounding suburban or rural areas — a phenomenon known as the urban heat island (UHI) effect. The main cause of the urban heat island effect is modification of the land surface by urban development, which uses materials which effectively retain heat.
The urban heat island effect is anticipated to be intensified as extreme heat events increase with climate change. Heat events will increase in severity and intensity, especially in urban areas like Baltimore City, leading to a rise in daily temperatures.
Elevated temperatures from UHI’s impact the community in the following ways;
- Increased energy consumption
- Elevated emissions of air pollutants and greenhouse gases
- Compromised human health and comfort
- Impaired water quality
Several elements are known to reduce the impact of UHI’s;
- Permeable surfaces on roadways, sidewalks, parking lots, and alleys
- Vegetated or green roofs
- Urban tree canopies
- Green spaces on vacant lands
Heat waves and heat islands
Heat waves are the deadliest form of climate hazard in the United States today. The impacts are particularly severe in cities like Baltimore, where the summertime weather and the “urban heat island” effect combine to create periods of extremely high temperature and humidity that are uncomfortable for almost everyone and have serious health impacts for the elderly, children with asthma, and people with pulmonary conditions.
Where is the Urban Heat Island in Baltimore City
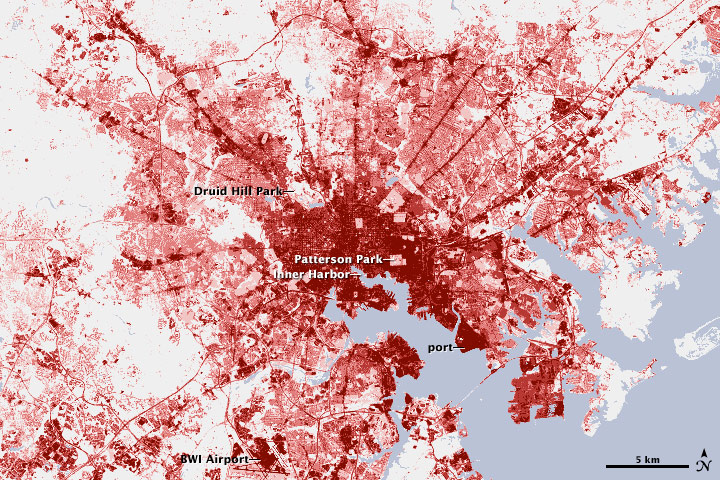
In general, cities are warmer than rural areas because asphalt, concrete, steel and bricks absorb sunlight and release heat back into the atmosphere. The relationship between temperature and land cover is shown in this pair of images. The top image shows how developed the landscape around Baltimore is. Areas that are red have a high concentration of cement and asphalt (impervious surfaces), while white areas are primarily covered by plants.
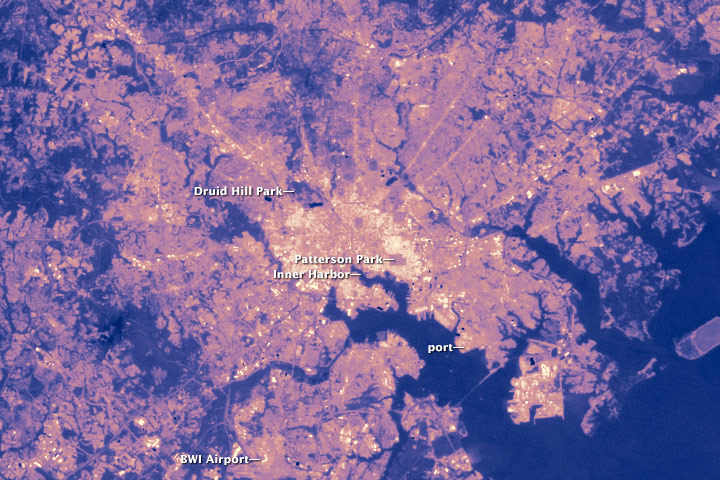
The bottom image shows the approximate temperature of the land surfaces (how hot the land would be to the touch) on a summer’s day in Baltimore. The highest temperatures are yellow, while cool temperatures are deep purple. Spikes in temperature away from the city occur along in the areas of development outside of the city and near the airport.
![]()
![]()
How is the City of Baltimore working to reduce UHI’s?
In 2014, the B’more Cool project team was formed to improve our understanding of the heat burden in underserved neighborhoods of Baltimore and to identify ways to reduce heat impacts through awareness, warnings, and heat island mitigation. To do this, climate and health scientists from Johns Hopkins University, MICA urban design experts, planners and disaster experts from the City of Baltimore Office of Sustainability, and local community groups were brought together to study and address problems of high temperatures and heat exposure.
The goal of B’more Cool is to generate science-based analysis of heat vulnerabilities in order to inform heat warning and heat island mitigation activities. This requires a high resolution baseline analysis of temperatures across the City, careful monitoring and modeling of heat mitigation efforts, and collaborative evaluation of existing and planned heat reduction strategies. These objectives will be met using a combination of satellite data fusion, urban mesoscale modeling, in situ monitoring through citizen science, and cohort studies of Chronic Obstructive Pulmonary Disease and asthma in urban populations.
Data
Attached are Data Sheets from May 29th-September 25th of 2015
Additional Information
“What You Can Do to Reduce Heat Islands” (EPA)
“What Makes Cities Hot? An Urban Heat Island Activity”—Lesson Plan and Curriculum Write Up (NASA)
East Baltimore Weather Station (Amazing Grace Evangelical Lutheran Church)
“Reducing Urban Heat Islands: Compendium of Strategies” (EPA)
“Climate Change and Extreme Heat Events” (Centers for Disease Control and Prevention)